


Google Sheets is a popular online spreadsheet application. It allows you to create, update, and modify data in real-time. Also, it can help you turn the data into a more digestible format.
For example, you can create a simple bar chart to uncover critical insights from datasets. But where are the steps for building it?
In this post, you will find a step-by-step guide that enables you to create a bar graph in Google Sheets. Let’s dive in.
Why Do I Need To Make A Bar Chart?
Bar graphs are extremely effective at creating simple visualizations. You can use them in presentations and efficiently convey key data insights to the audience.
Bar graphs help you effortlessly compare items between different groups. For example, they are handy for visualizing annual sales. They enable you to effectively display and compare the data by quarters on a year-over-year trend.
Therefore, you can quickly analyze annual sales, find essential insights, and make effective business decisions.
For example, how Can I Make A Bar Chart In Google Sheets?
The process of creating a bar chart in Google Sheets is straightforward. Follow these steps:
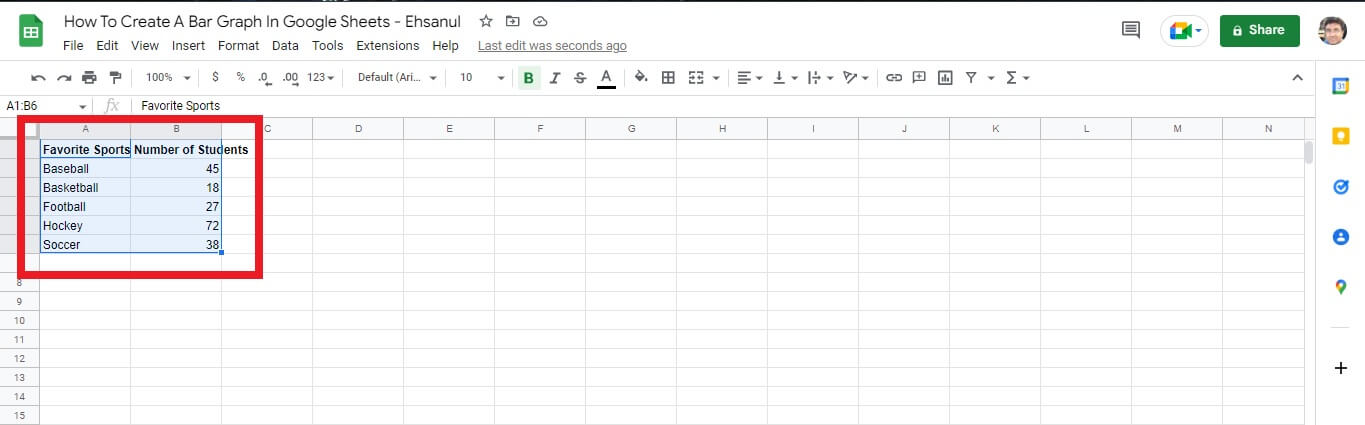
1. First, open your spreadsheet with Google Sheets.
2. Select the data for which you want to create the bar graph.
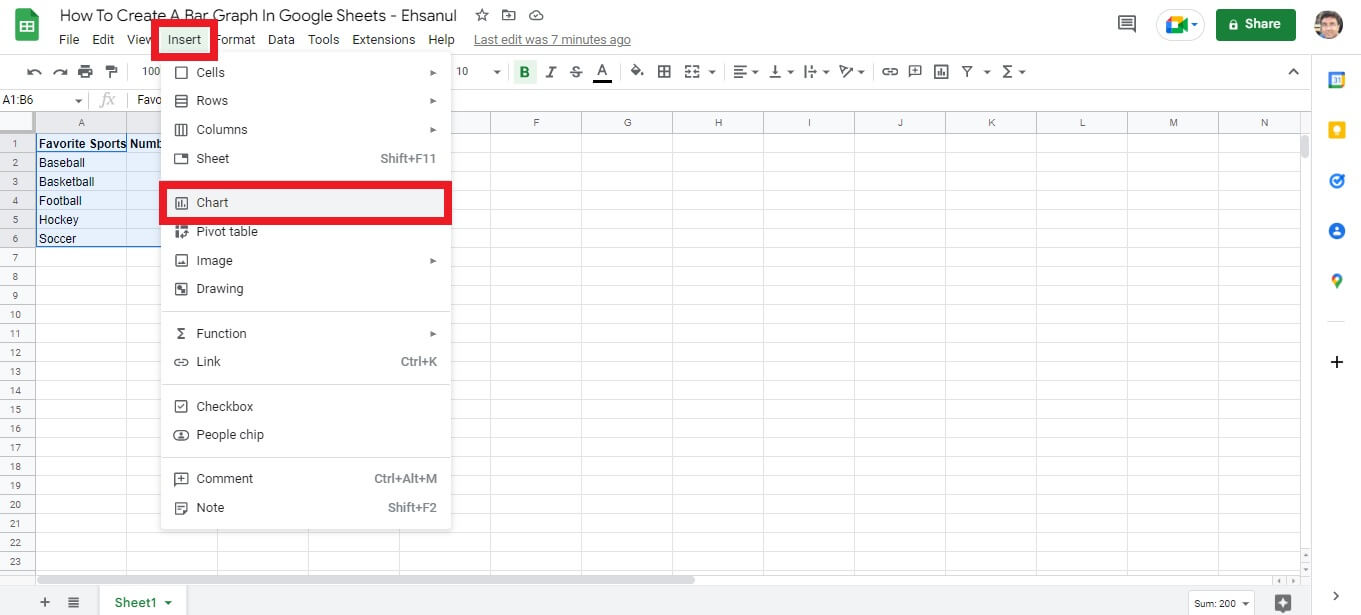
3. Next, navigate through Insert > Charts.
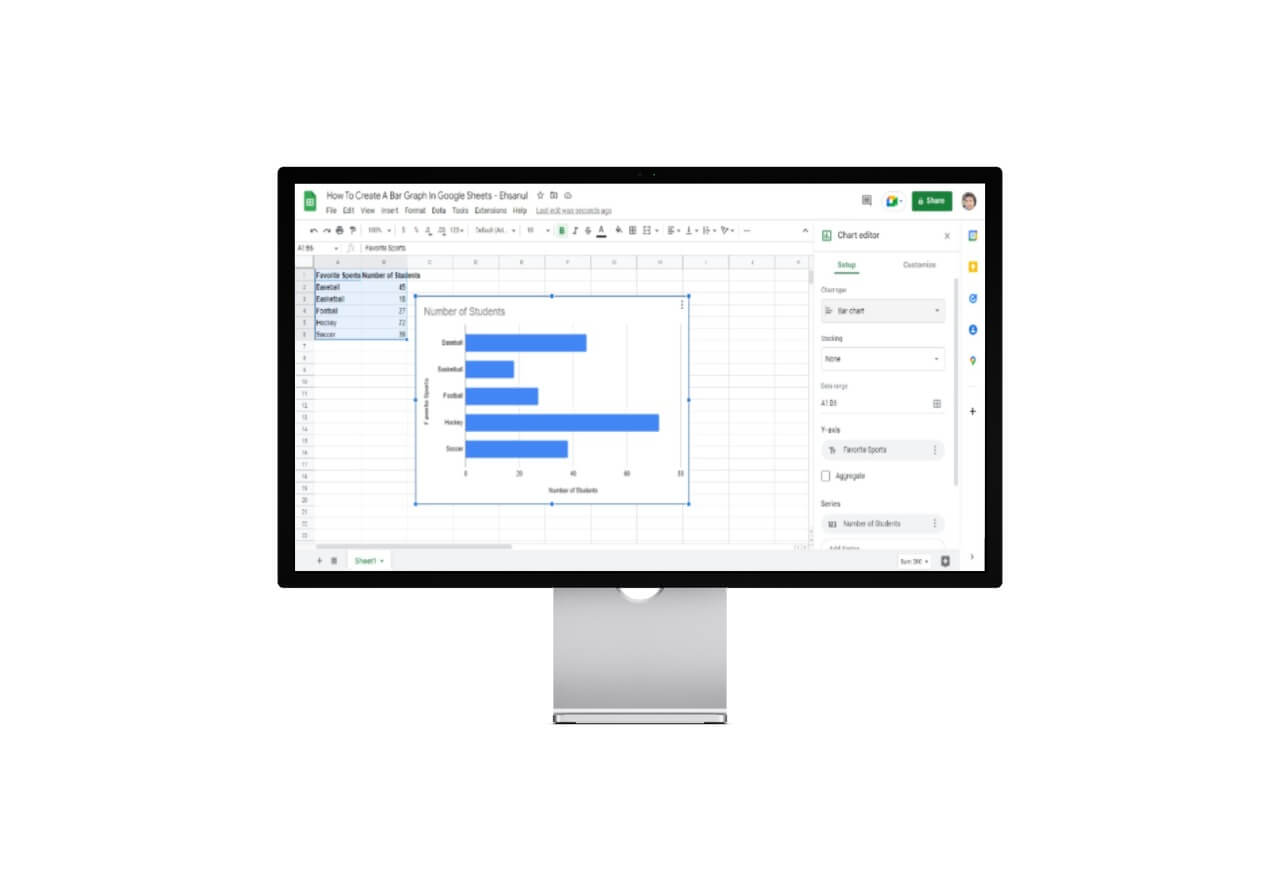
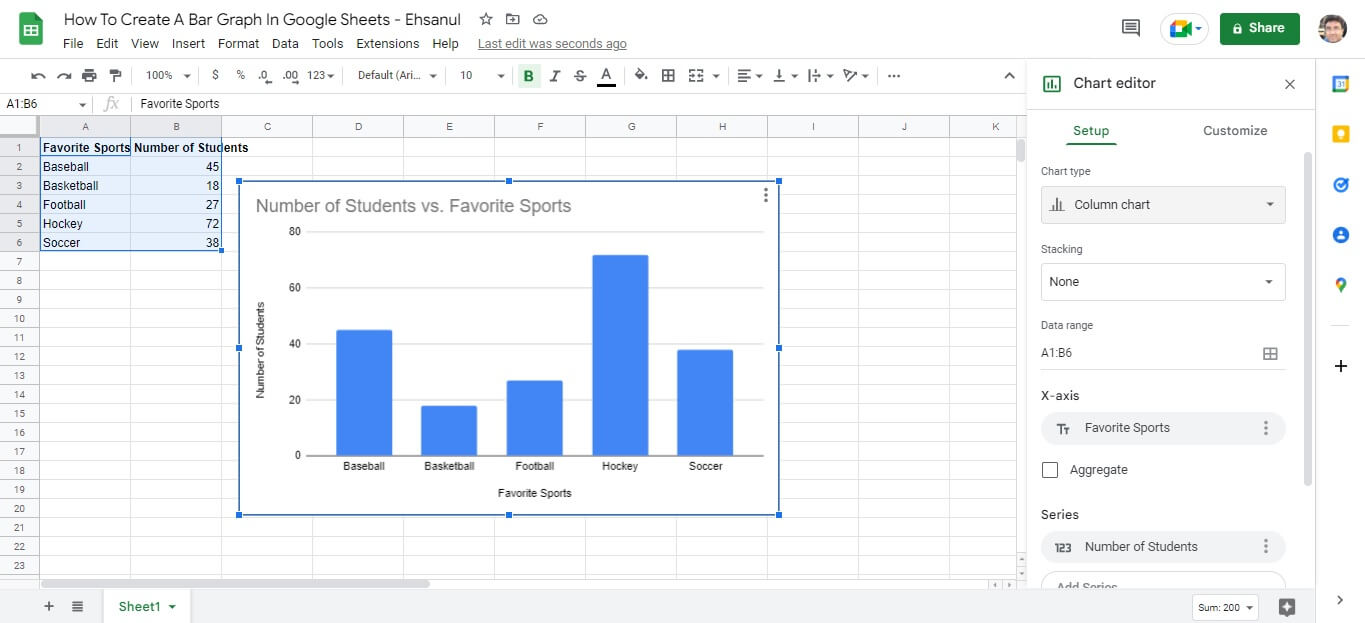
4. Then, the chart editor will show up. Under Chart type, click the drop-down menu. Then scroll down to find the Bar. Click on the first bar chart.
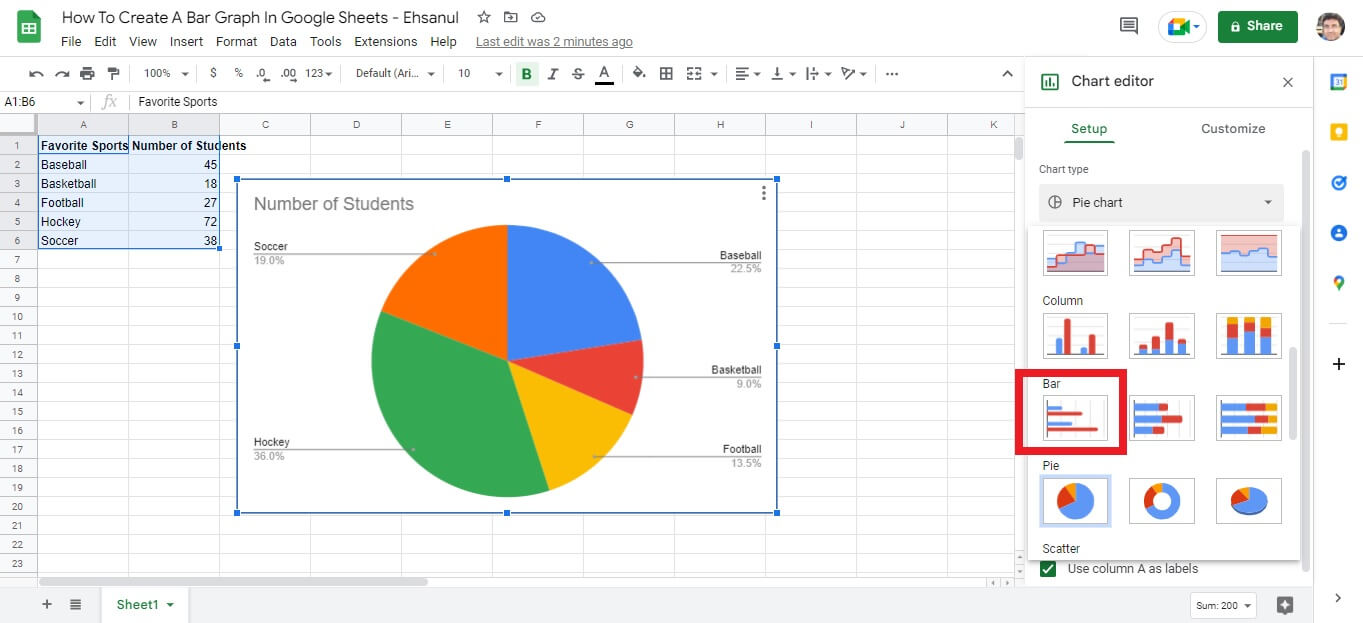
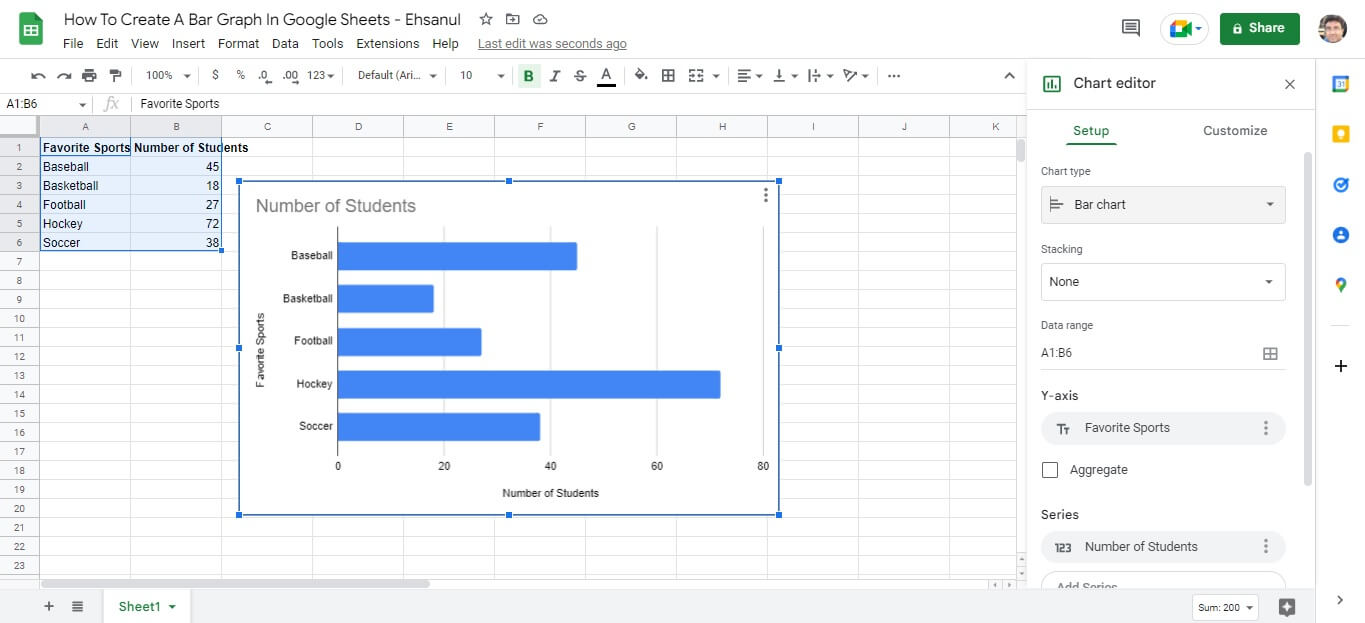
5. You will find that a beautiful bar chart has been created.
That’s how you make a bar graph in Google Sheets. Now, let’s dive into more details. How about creating labels?
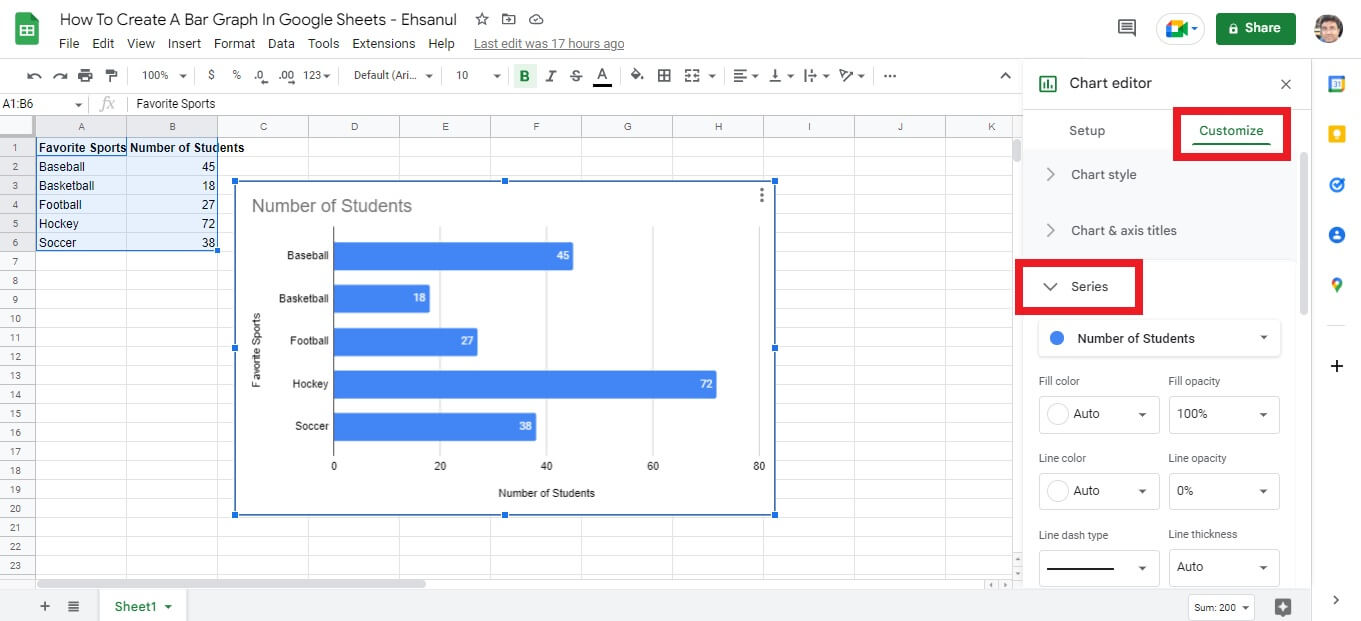
Create A Bar Graph’s Label
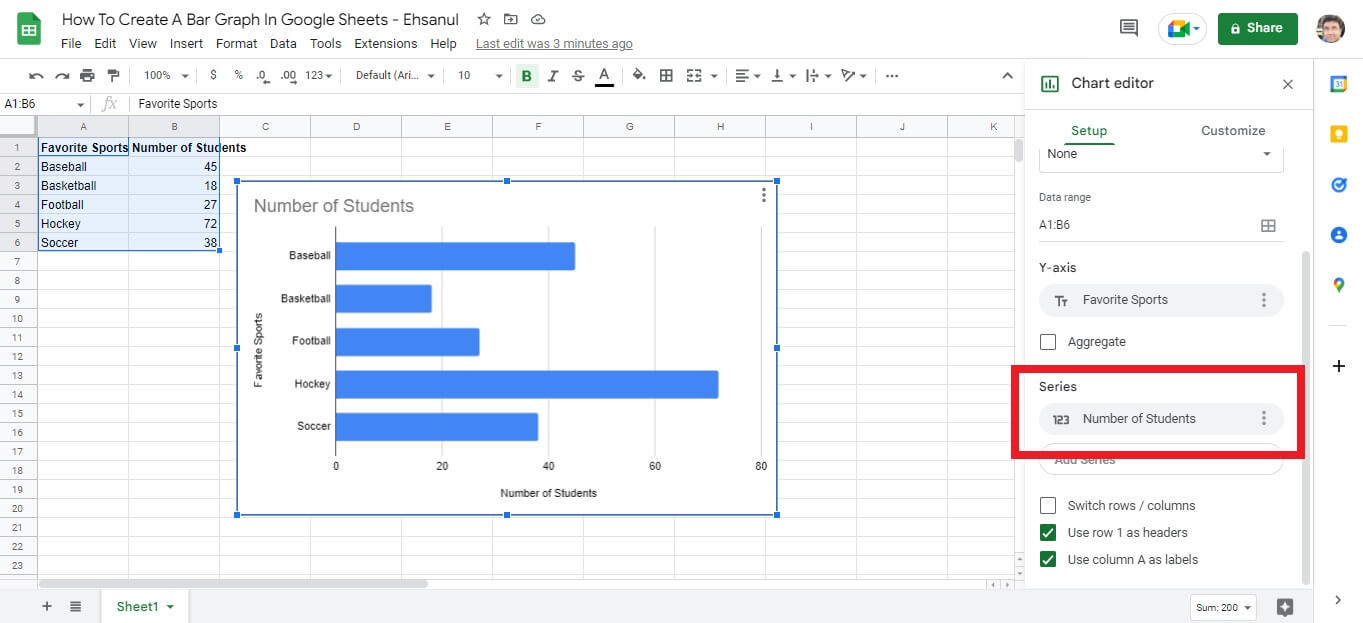
1. First, navigate through Setup > Series in the chart editor. Select your preferred series.
2. Then click on the three dots beside it. Click on Add labels.
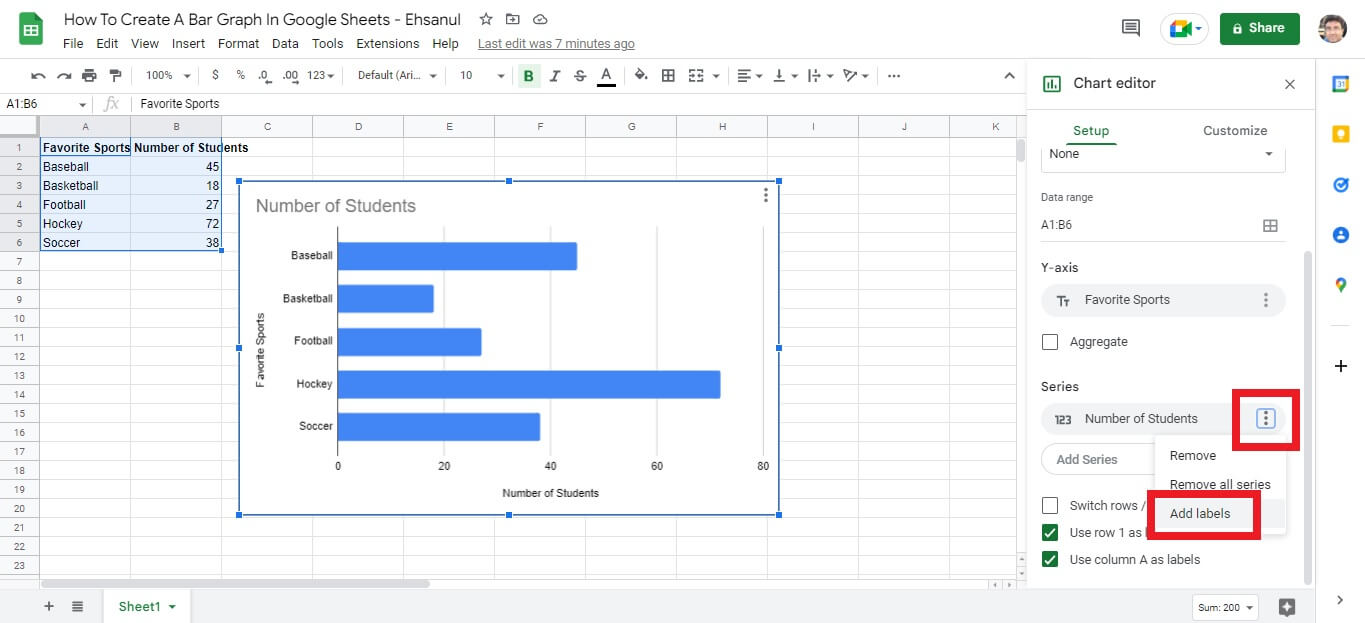
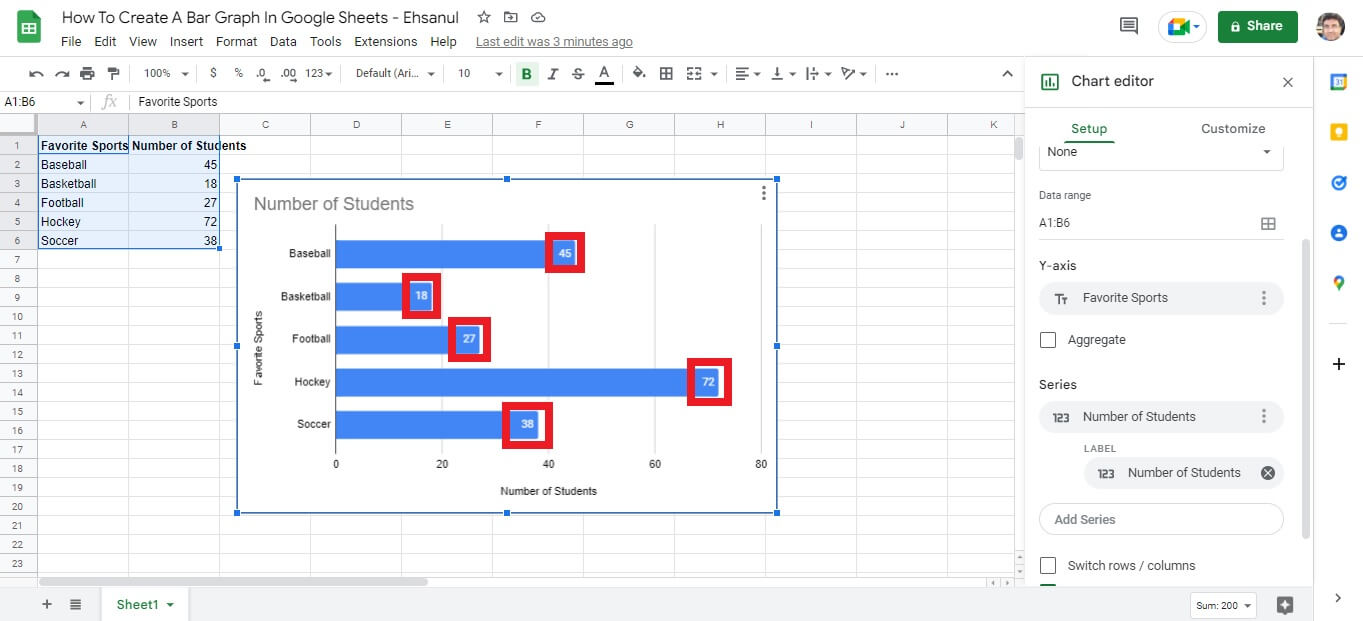
3. Next, you have to choose your desired label. In this case, we will select the Number of Students.
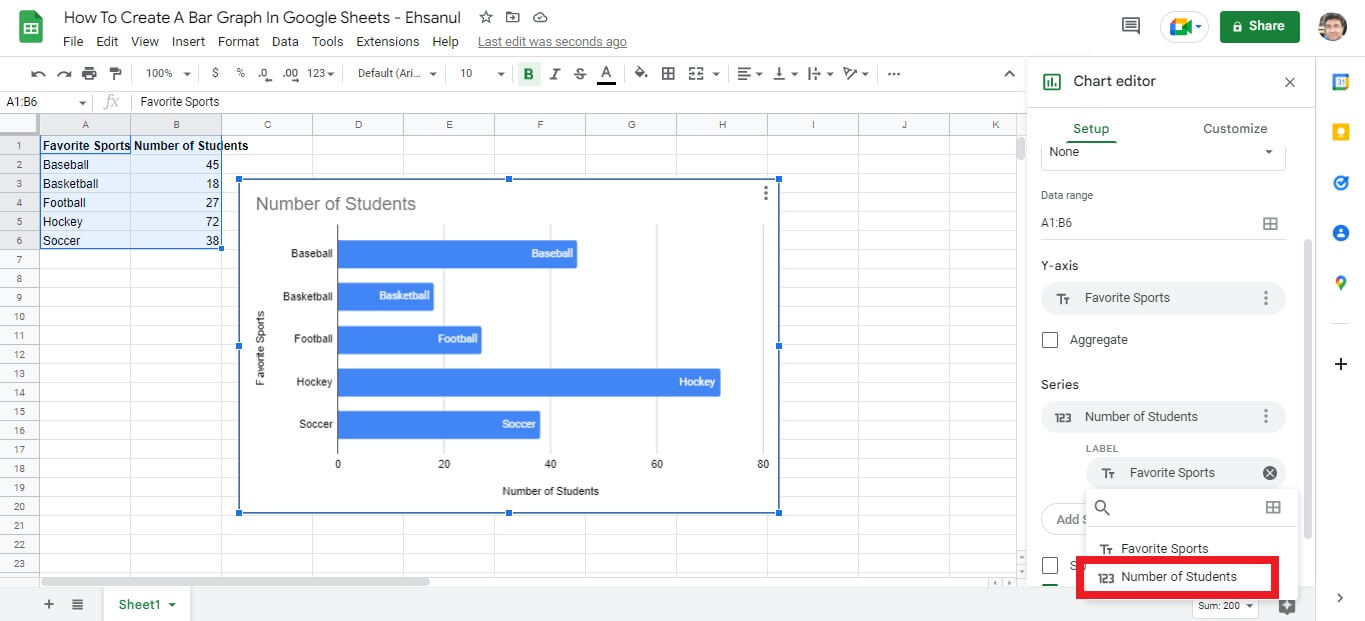
4. You will find the labels have been added.
That’s how you create a bar graph’s label in Google Sheets.
Create A Bar Graph’s Customization
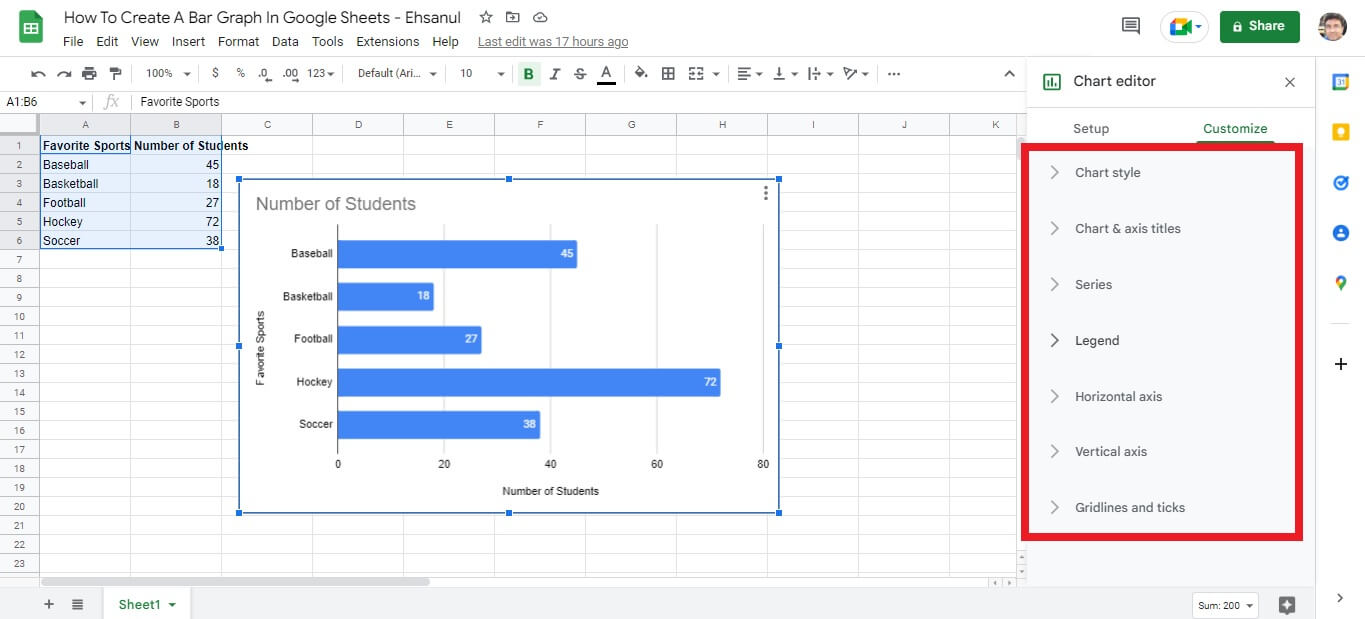
1. First, go to Chart editor > Customize.
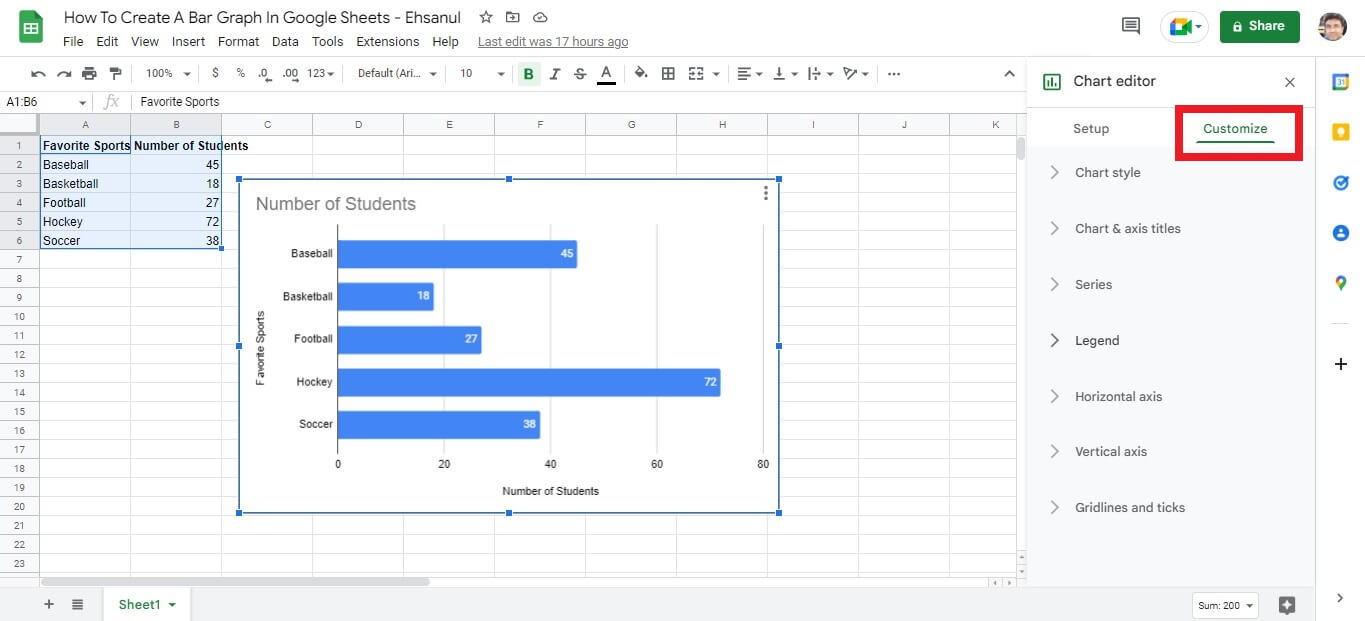
2. Then, you will find all the customization features. You can change the chart style and axis titles. Also, you can customize the horizontal axis, vertical, axis, legends, etc.
Error Bars
Error bars are graphical representations of the variability of data. They indicate the error or uncertainty in your dataset. You can easily create a bar chart’s error bars with Google Sheets. Here are the steps:
1. First, go to Chart editor > Customize. Expand Series.
2. Then scroll down and find the Error bars field. Check the box and specify the percentage value.
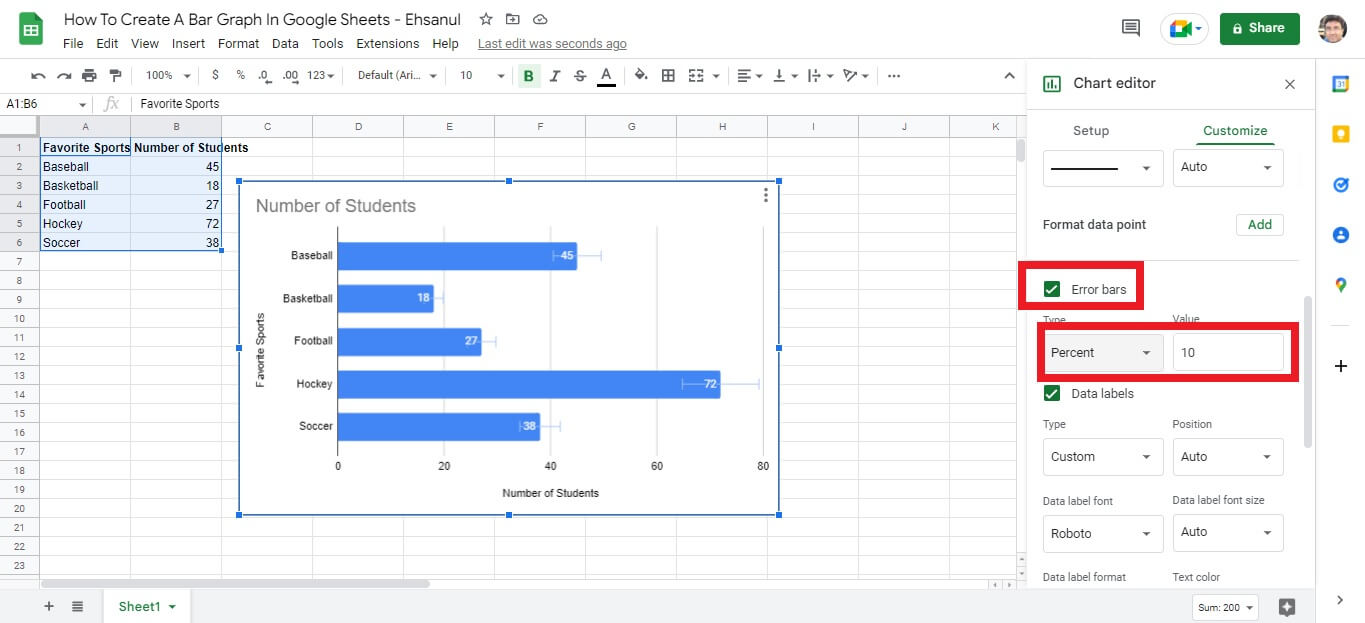
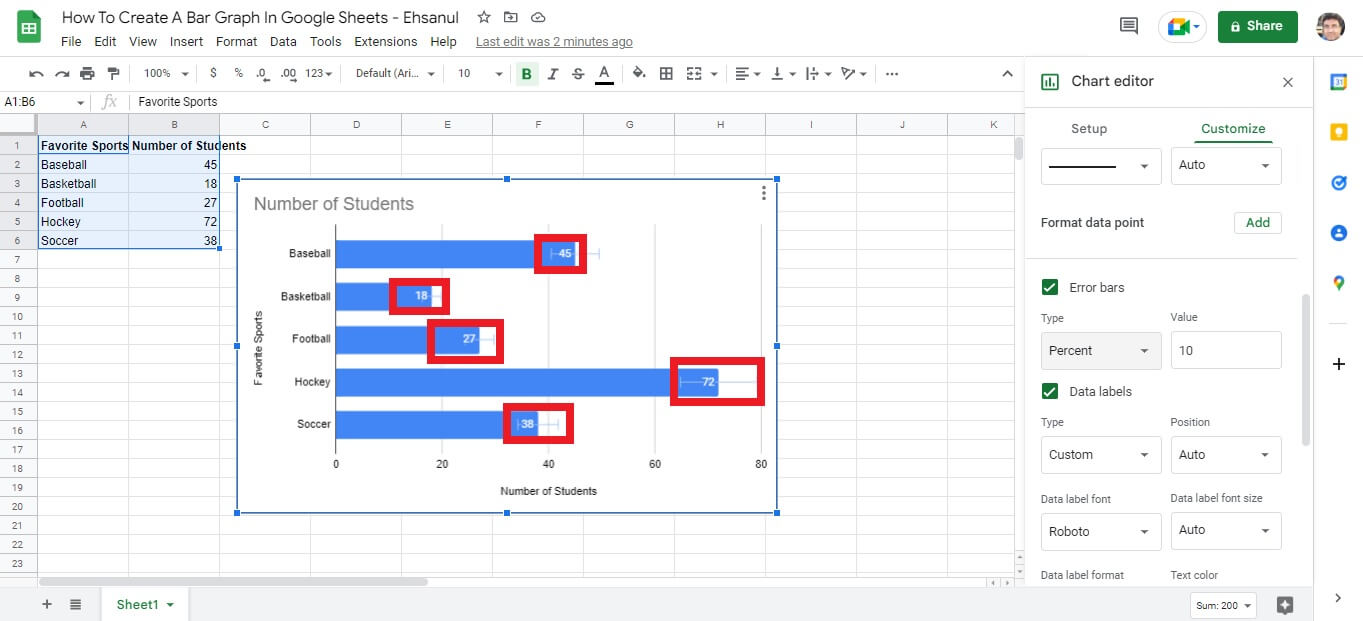
3. You will find the error bar created in the bar graph.
Change The Type Of Visualization
You should represent the data with a different type of visualization, like the Column Chart. To do it, you need to follow these steps:
1. First, go to Chart editor > Setup.
2. Then click on the drop-down below Chart type. Then, scroll down and select the Column chart.
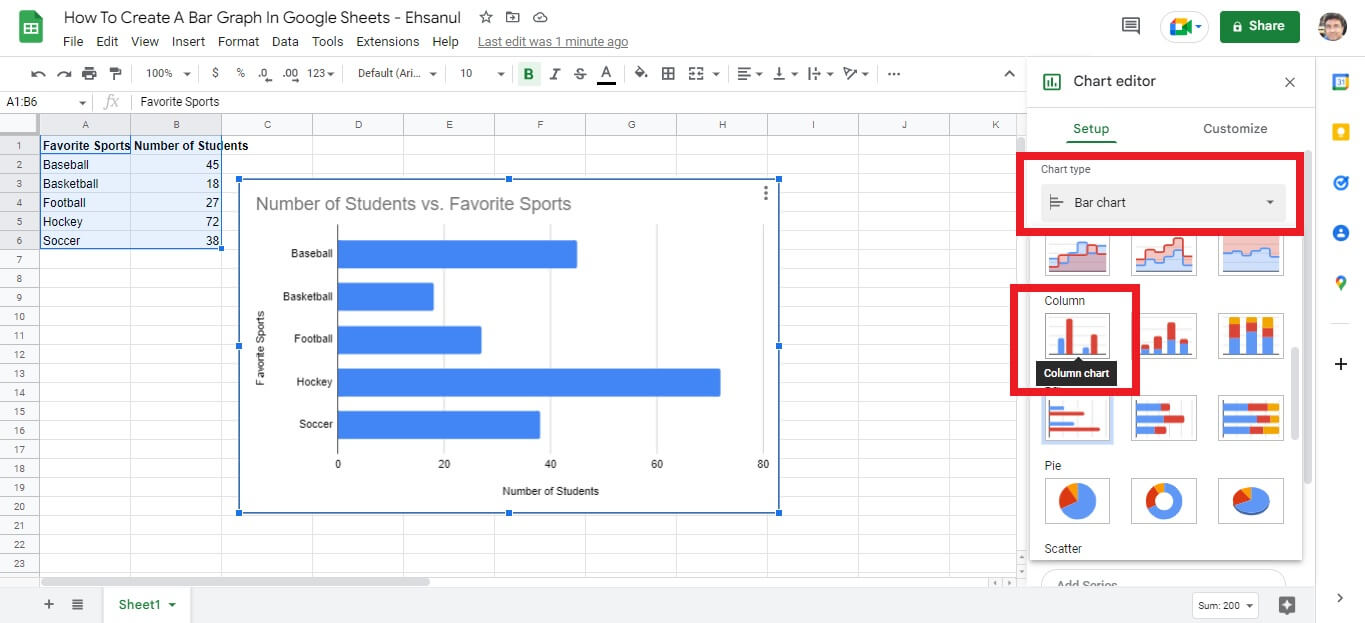
3. You will find that the chart type has been changed to Column chart.
Is It Possible To Use JavaScript Visualization Libraries In Google Sheets?
Yes, it is possible to use JavaScript visualization libraries in Google Sheets. It will enable you to represent data with amazing visuals.
Can I Analyze Google Sheets With FusionCharts?
With FusionCharts, you can quickly analyze data on Google Sheets. You must load Google Sheets data to a database or cloud data warehouse.
Next, you have to connect FusionCharts to it. Then you can start analyzing data.
There are different solutions for doing it. For example, you can use Stich to integrate with your data warehouse. Hence, you can effortlessly turn your data into actionable insights.
Read: The Anatomy Of A Great Graph Maker
FAQ
How do I create a bar graph?
You can create a bar graph using MS Word or Excel. However, if you have coding knowledge, you should use some JavaScript framework. It enables you to create a beautiful bar graph with just a few lines of code.
How do I create a bar graph in Excel?
If you use the latest Excel version (2019), go to the Insert tab. Then click on the Insert Column or Bar Chart icon. Then choose your preferred bar chart option.
Where can I make a bar chart?
You can make a bar chart in all popular software, including MS Word and Excel. However, you can create the graph using frameworks if you are a developer. It is an easy-to-use JavaScript charting library.
Can I make a bar graph in Word?
Yes, you can create a bar graph in Word. Go to the Insert tab and click on Chart. Then scroll down and choose your desired graph type. Once you are done, click on the OK button.
What is a simple bar graph?
A simple bar graph is a graph that represents data using a rectangular bar. You can use it to visualize data involving a single variable classified on a spatial, quantitative, or temporal basis.
Keywords: Bar Chart, Bar Graph, Customization, Fusioncharts, Google Sheets, Label, SpreadSheet